It doesn't just show numbers. It explains what they mean.
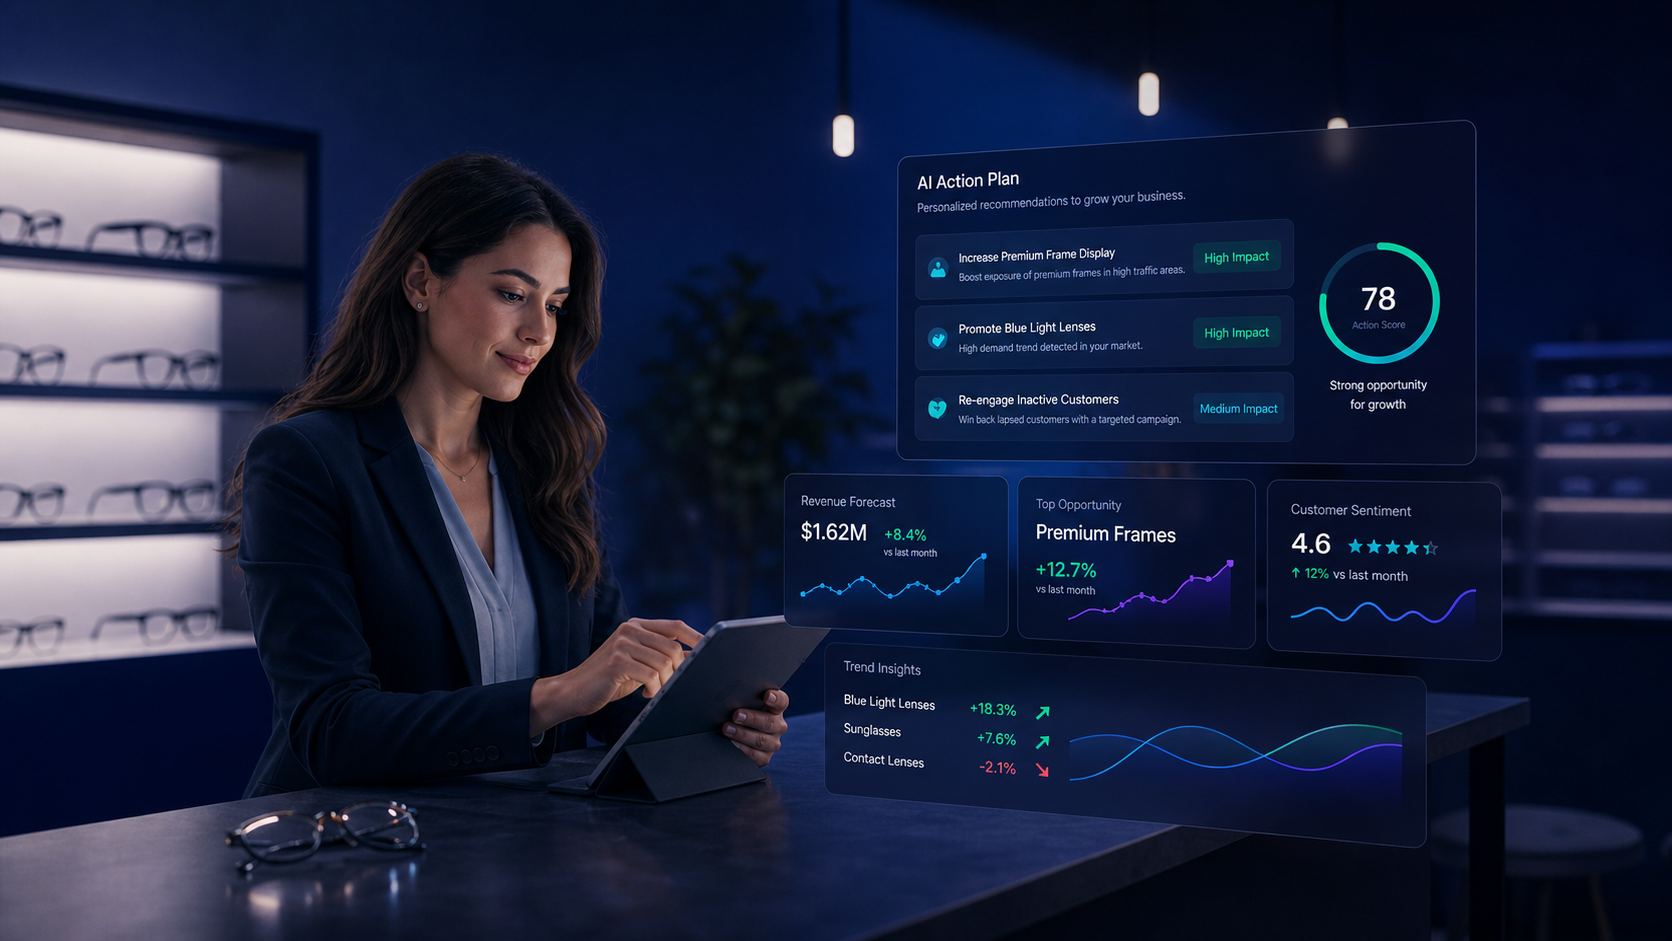
OpSightIQ's AI engine analyzes your store performance data and turns it into clear, structured insights and practical action plans — written in plain English, ready to share with your team.
From raw data to clear direction
OpSightIQ's AI engine doesn't just summarize your data — it interprets it. It identifies what is driving performance, what is holding it back, and what your team should do about it.
Performance Narrative
A plain-English explanation of what happened in your stores during the selected period — not just the numbers, but the story behind them.
Driver Identification
The AI identifies specific factors that are contributing to strong or weak performance — revenue trends, order volume shifts, AOV changes, collection rate patterns.
Risk Detection
Areas of concern are flagged with context — not just "revenue is down" but why it may be down and what the pattern suggests about the underlying cause.
Action Plans
Specific, prioritized recommendations for each store — what to do, why it matters, and what outcome to expect if the action is taken.
Executive Summaries
A concise overview of network performance suitable for leadership review, board reporting, or franchise partner updates.
Manager Talking Points
Ready-to-use talking points for store managers to use in team meetings, framing performance data in a constructive, motivating way.
Nine sections. One complete picture.
Every AI analysis report is structured into clear sections so your team can quickly find the information they need — whether they want the full picture or just the action items.
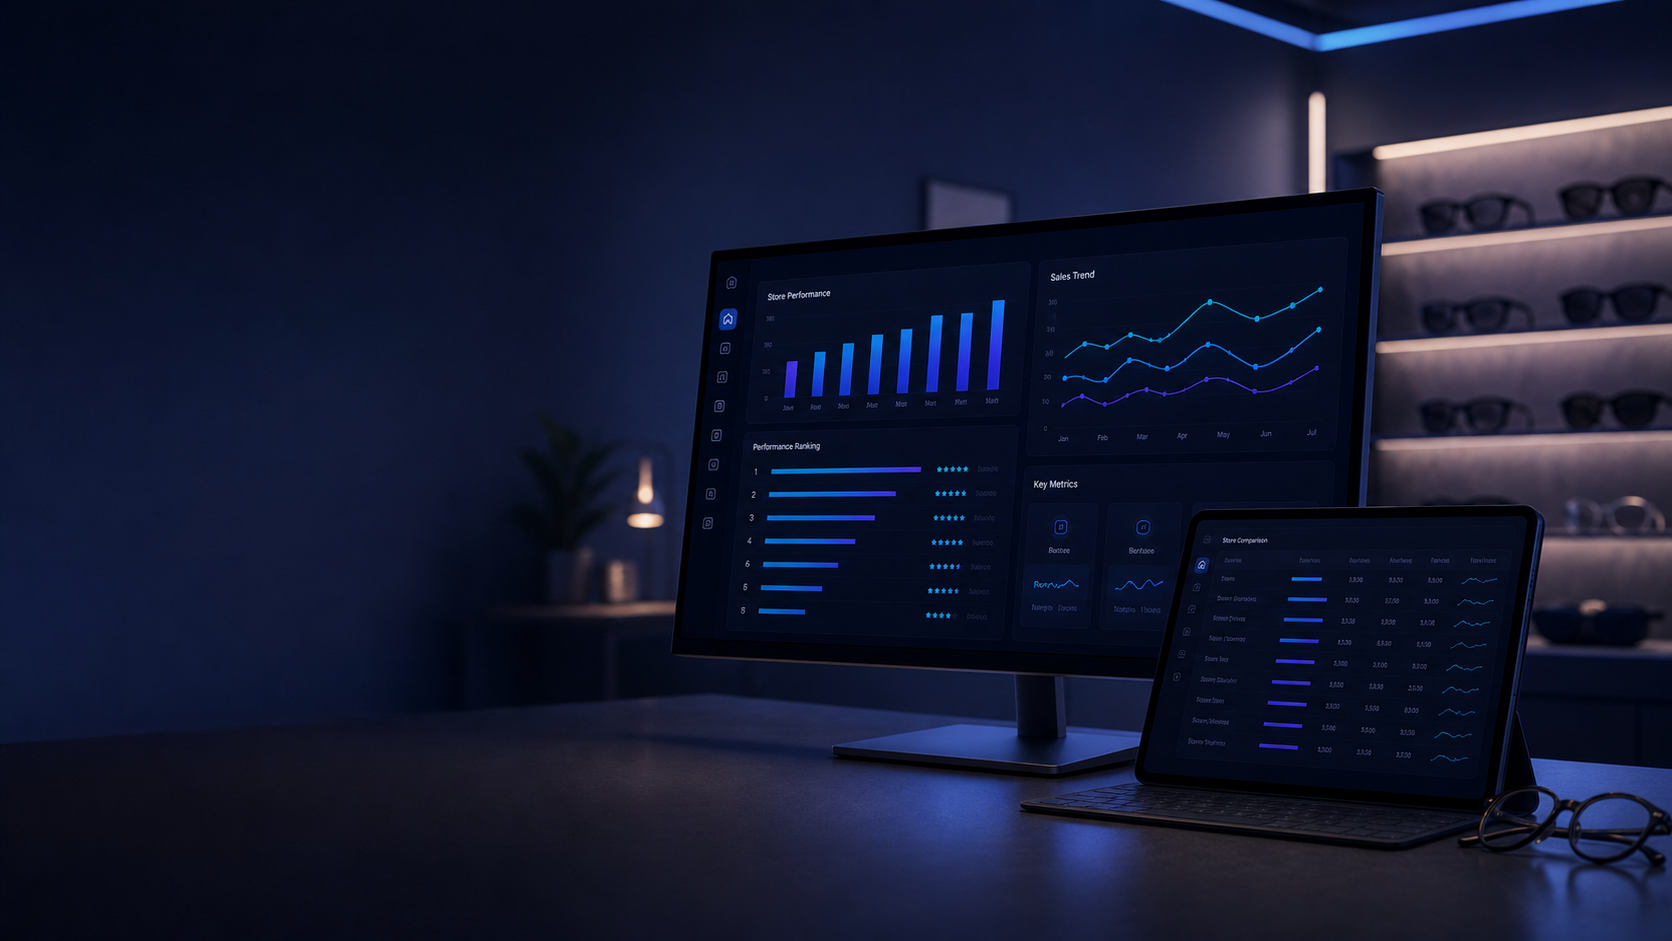
Analyze one store or compare all of them
OpSightIQ's AI analysis works at both the individual store level and across your entire network. Run a single-store deep dive or a multi-store comparison — the AI adapts its analysis to the scope you choose.
- Single-store analysis for detailed location-specific insights
- Multi-store comparison analysis highlighting performance gaps
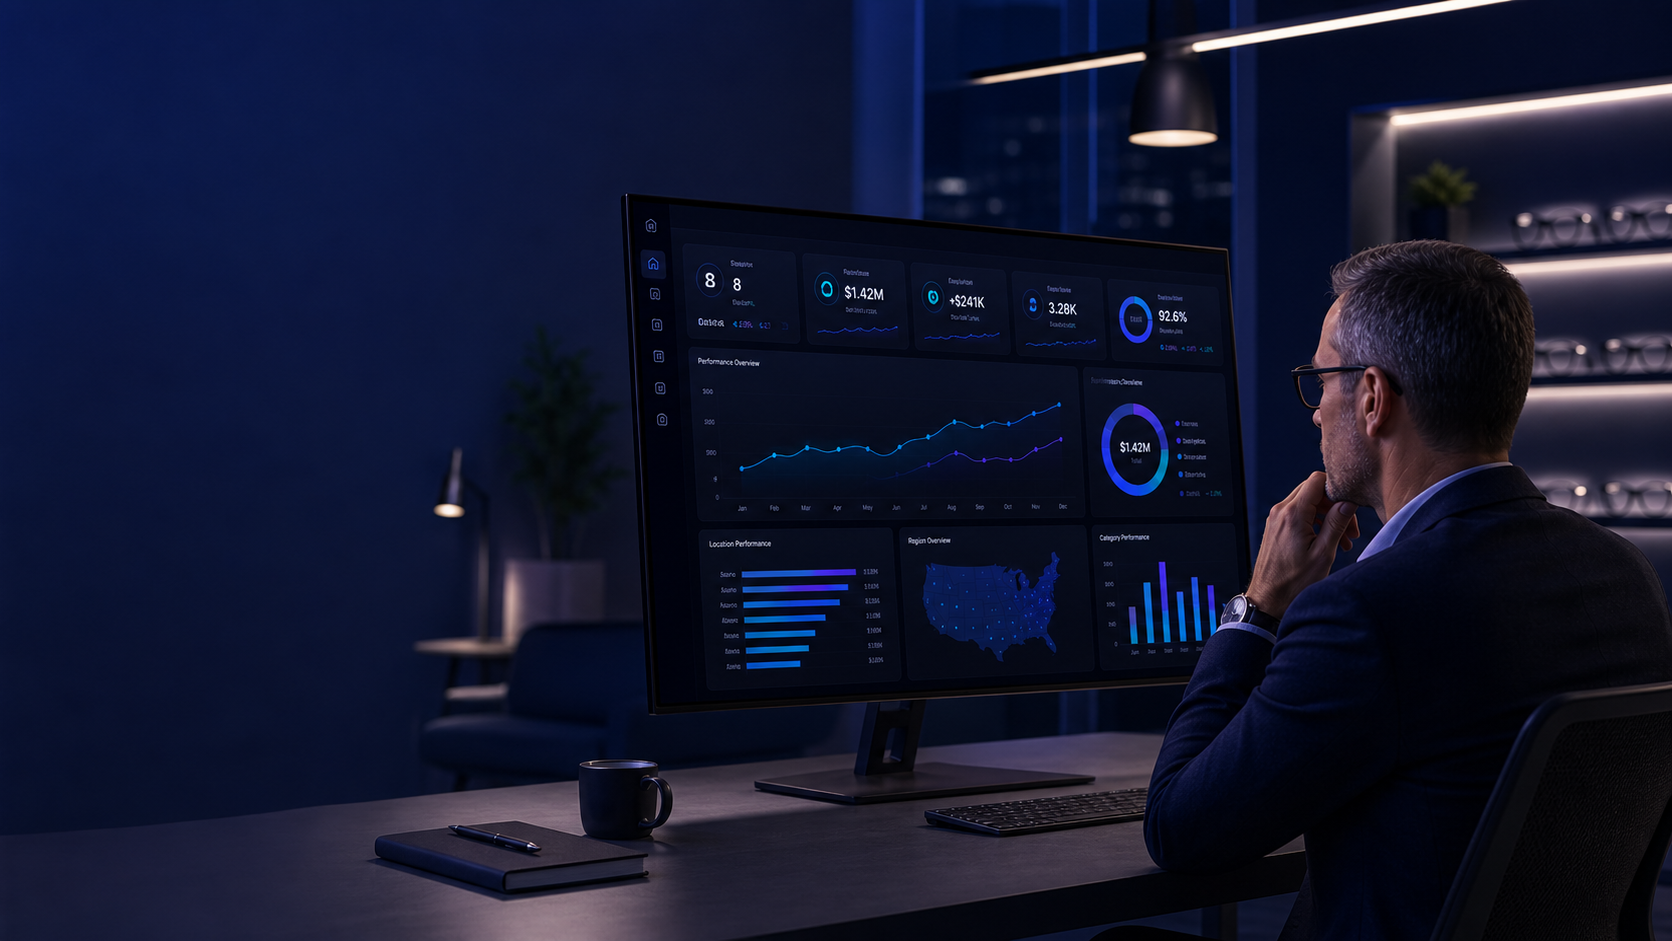
- Network-wide analysis for corporate and franchise leadership
- AI commentary on what performance differences mean operationally
- Identification of which stores need attention and which are leading
- Best-practice identification from top-performing locations
Ask questions about your store data
Beyond structured reports, OpSightIQ includes an AI chat interface where you can ask ad-hoc questions about your store performance data and get immediate, context-aware answers.
- Natural language questions about any store's performance
- Context-aware answers based on your actual imported data
- Comparison queries: "How does Store 004 compare to Store 017?"
- Trend queries: "What happened to our average sale in Q1?"
- Recommendation queries: "What should we focus on this month?"
- Pre-built example prompts to help your team get started
Share AI insights with your team
AI insights are only valuable if they reach the people who can act on them. OpSightIQ makes it easy to export and share reports in the format that works best for your team.
PDF Export
Download a formatted PDF report suitable for printing or sharing in leadership meetings.
Word Document
Export to Word format for easy editing and customization before sharing with your team.
Plain Text
Copy plain text for pasting into emails, Slack messages, or other communication tools.
Print Preview
A clean print-optimized view for physical copies or PDF printing from your browser.
Questions about the AI analysis
The AI analysis is based on the data you import into OpSightIQ — sales figures, order volumes, average sale values, collection rates, and any other metrics included in your import files. The more complete your data, the more detailed and accurate the analysis will be.
Most AI analyses complete within 15 to 30 seconds. The platform shows a progress indicator while the analysis is being generated. Multi-store comparison analyses may take slightly longer depending on the volume of data being processed.
Yes. You can select any date range for the AI analysis, including specific months, quarters, or custom date ranges. The AI will analyze the data for the period you select and provide comparisons to prior periods where data is available.
Yes. OpSightIQ's AI is configured with context specific to optical retail operations — it understands metrics like collection rate, average sale, doctor days, and the relationship between these KPIs in the context of how optical stores operate. The analysis and recommendations reflect this domain knowledge.
The structured report sections are standardized for consistency, but you can export the analysis to Word format and edit it before sharing. The AI chat interface also allows you to ask follow-up questions or request analysis focused on specific areas of interest.
Ready to see what your data is really telling you?
Request a demo and see OpSightIQ's AI analysis engine working with real store data.