Your stores already generate the data.
OpSightIQ turns it into direction.
OpSightIQ turns sales reports, store performance data, and reputation metrics into clear insights, store comparisons, and action plans your team can actually use — on any device, anywhere.
Your data is there. The clarity isn't.
Most retail operators have more data than they know what to do with. The problem isn't the numbers — it's turning them into decisions fast enough to matter.
Reports Are Scattered
Sales data, review platforms, and operational reports live in different systems. Pulling them together takes hours you don't have.
Store Comparisons Are Manual
Understanding which locations are performing, which are slipping, and why requires manual work that rarely happens consistently.
Managers Need Direction
Store managers receive reports but not always the context or recommendations they need to take the right action next.
Reviews Get Ignored
Google reviews build up unnoticed until they become a reputation problem. By then, the damage is already done.
Corporate Needs Faster Visibility
Leadership teams need a reliable pulse on every location without waiting for weekly calls or manually compiled spreadsheets.
Franchise Reporting Is Complex
Franchise owners need simple, clear reporting that doesn't require a data analyst to interpret — just clear answers to clear questions.
One intelligent platform. Every store. Clear direction.
OpSightIQ gives retail operators a simple command center for performance, reputation, and AI-driven decisions. Instead of digging through reports, you get a clear picture of what is happening, why it may be happening, and what to do next.
- Performance dashboards that update automatically from your imported data
- AI analysis that explains the story behind the numbers in plain English
- Store comparisons that surface which locations need attention and which are leading
- Reputation tracking that monitors Google reviews and customer sentiment across all stores
- Action plans that give managers clear, practical next steps — not just charts
- Mobile access so leaders can check performance from anywhere, at any time
Everything your team needs in one place
From performance dashboards to reputation intelligence, OpSightIQ covers every dimension of your retail operation.
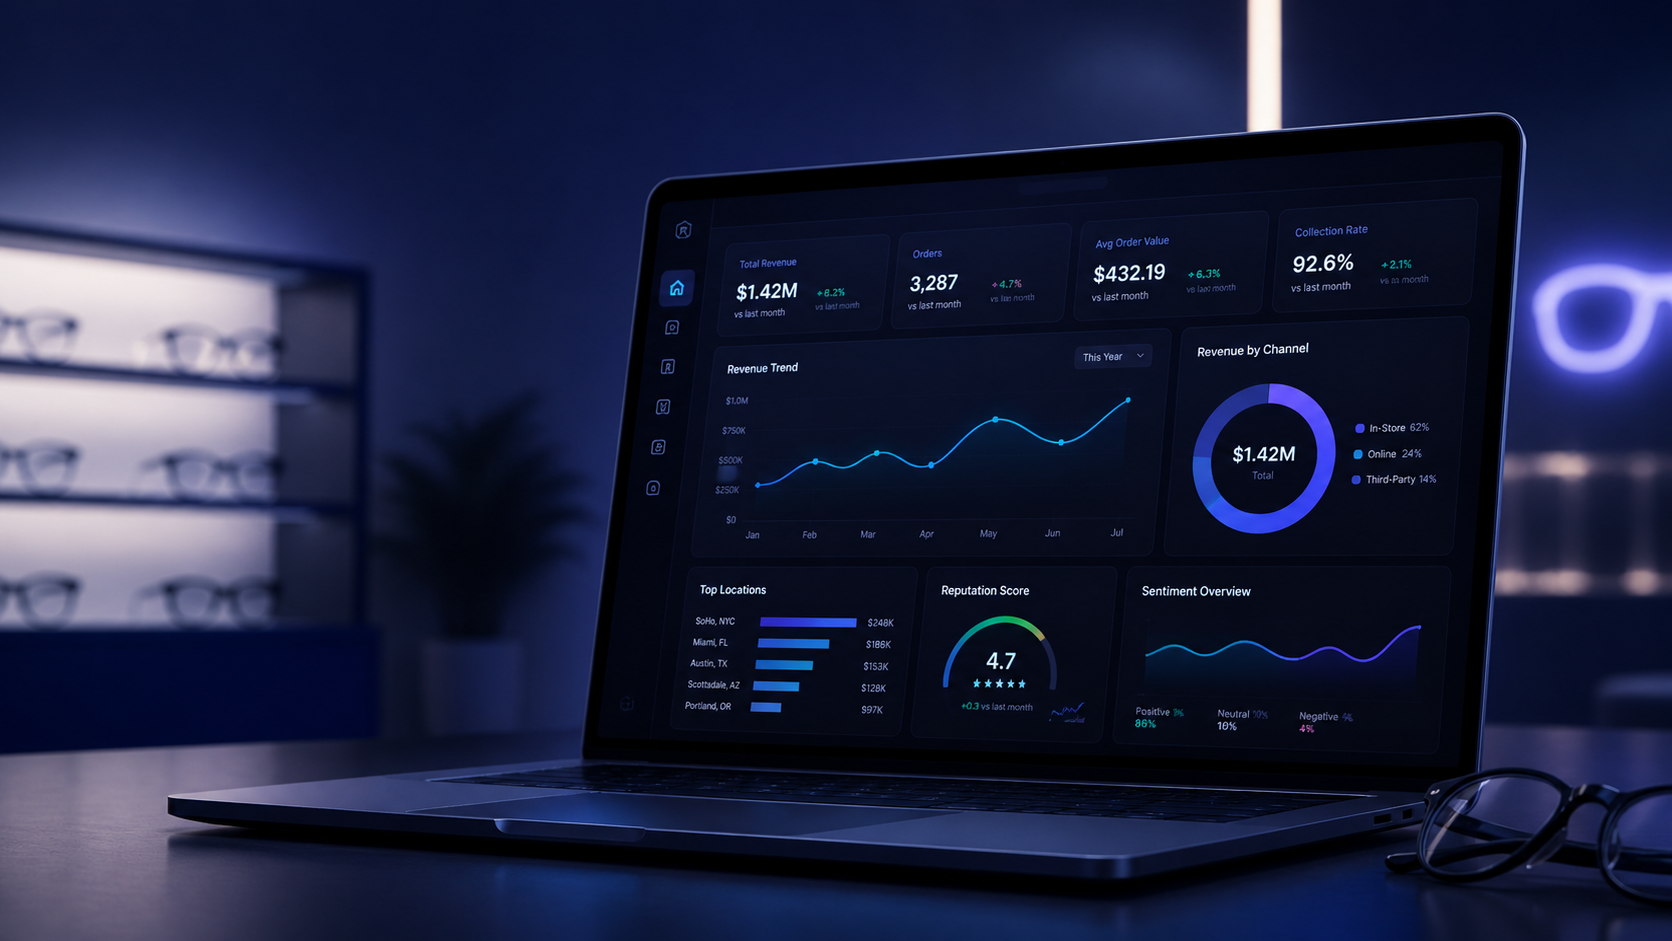
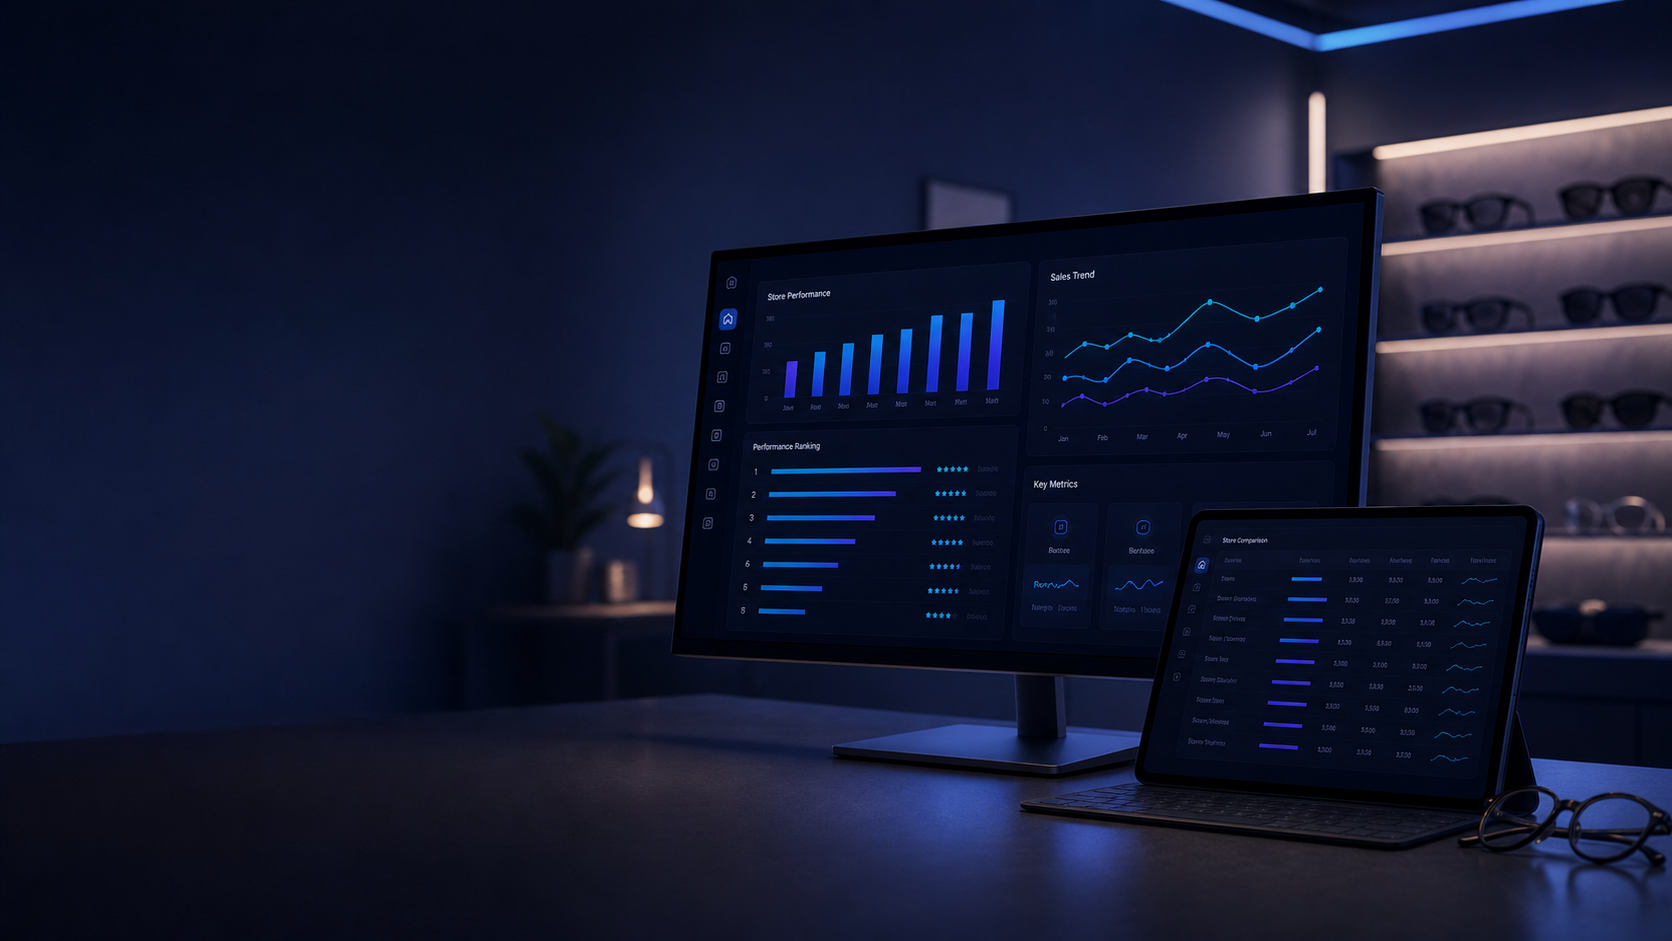
Performance Dashboard
Real-time KPI overview across all locations — revenue, orders, average sale, and collection rate at a glance.
Store Analysis
Deep-dive into individual store performance with trend charts, period comparisons, and AI-generated summaries.
Store Comparison
Side-by-side comparison of all locations ranked by performance, with AI commentary on what the gaps mean.
AI Insights
Plain-English analysis that explains revenue trends, identifies risk areas, and recommends specific next steps.
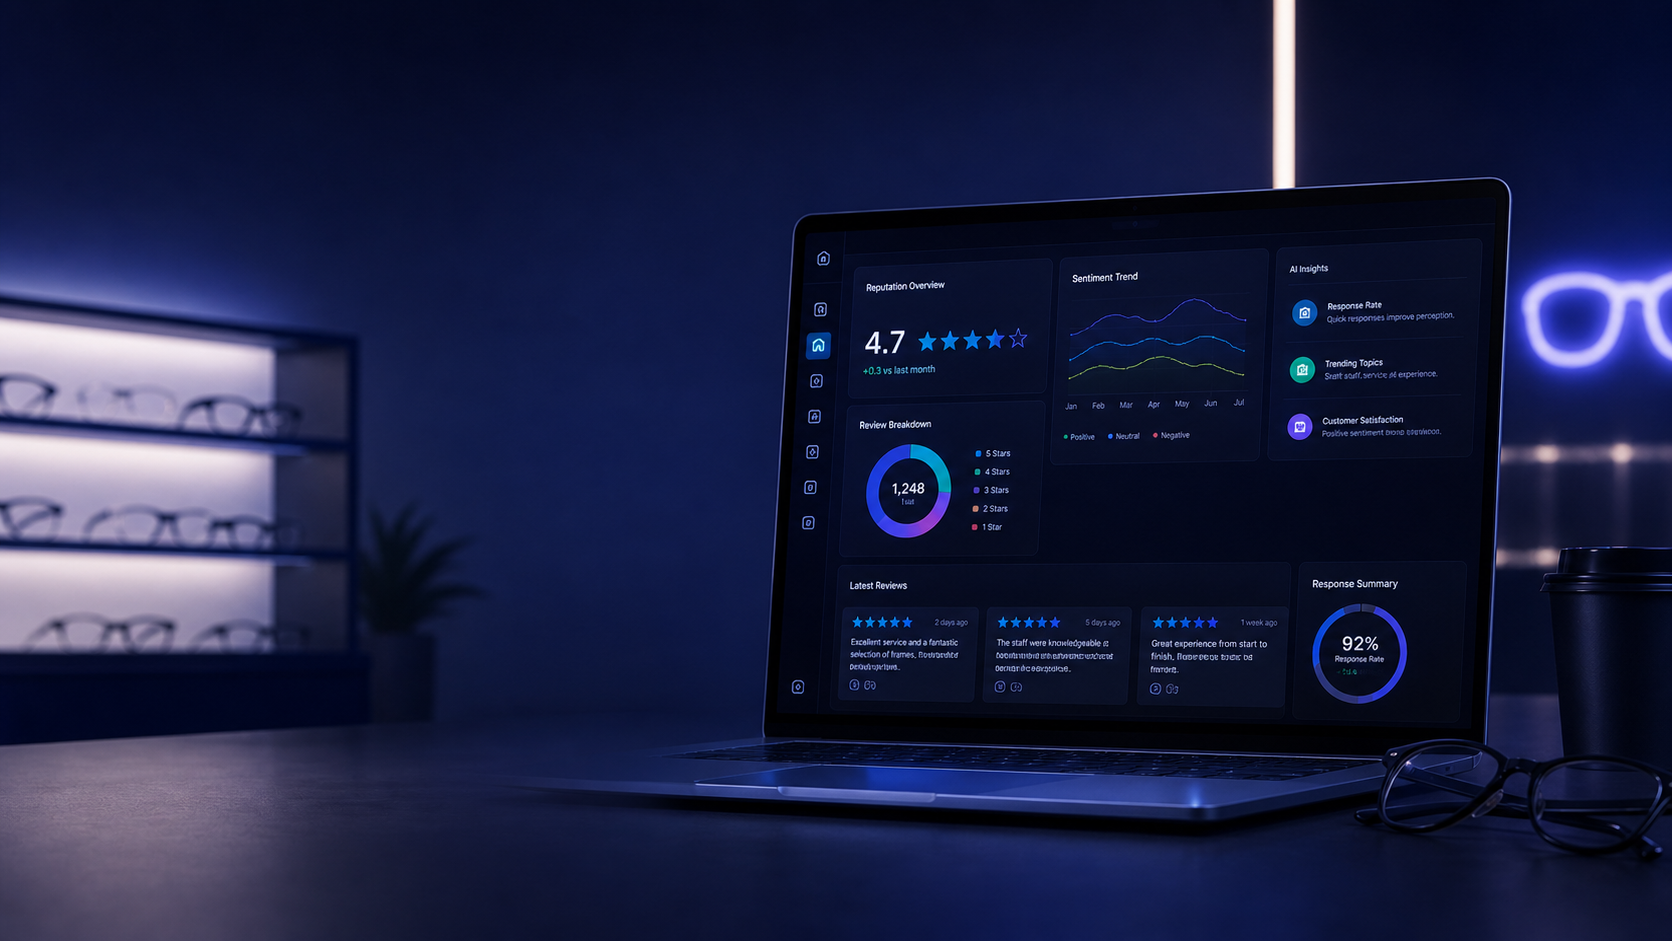
Reputation Dashboard
Track Google ratings, review volume trends, and sentiment scores across every location from one screen.
Review Analysis
AI-powered sentiment analysis that categorizes feedback, flags negative reviews, and surfaces common themes.
Action Plans
Monthly AI-generated action plans that give store managers clear, prioritized steps based on their actual data.
Data Import
Import sales data via CSV, XLSX, or JSON. Flexible field mapping supports multiple report formats.
Leaderboard
Friendly competition across locations with performance rankings that motivate teams and highlight top performers.
Role-Based Access
Granular permissions for owners, managers, and corporate teams — everyone sees what they need, nothing more.
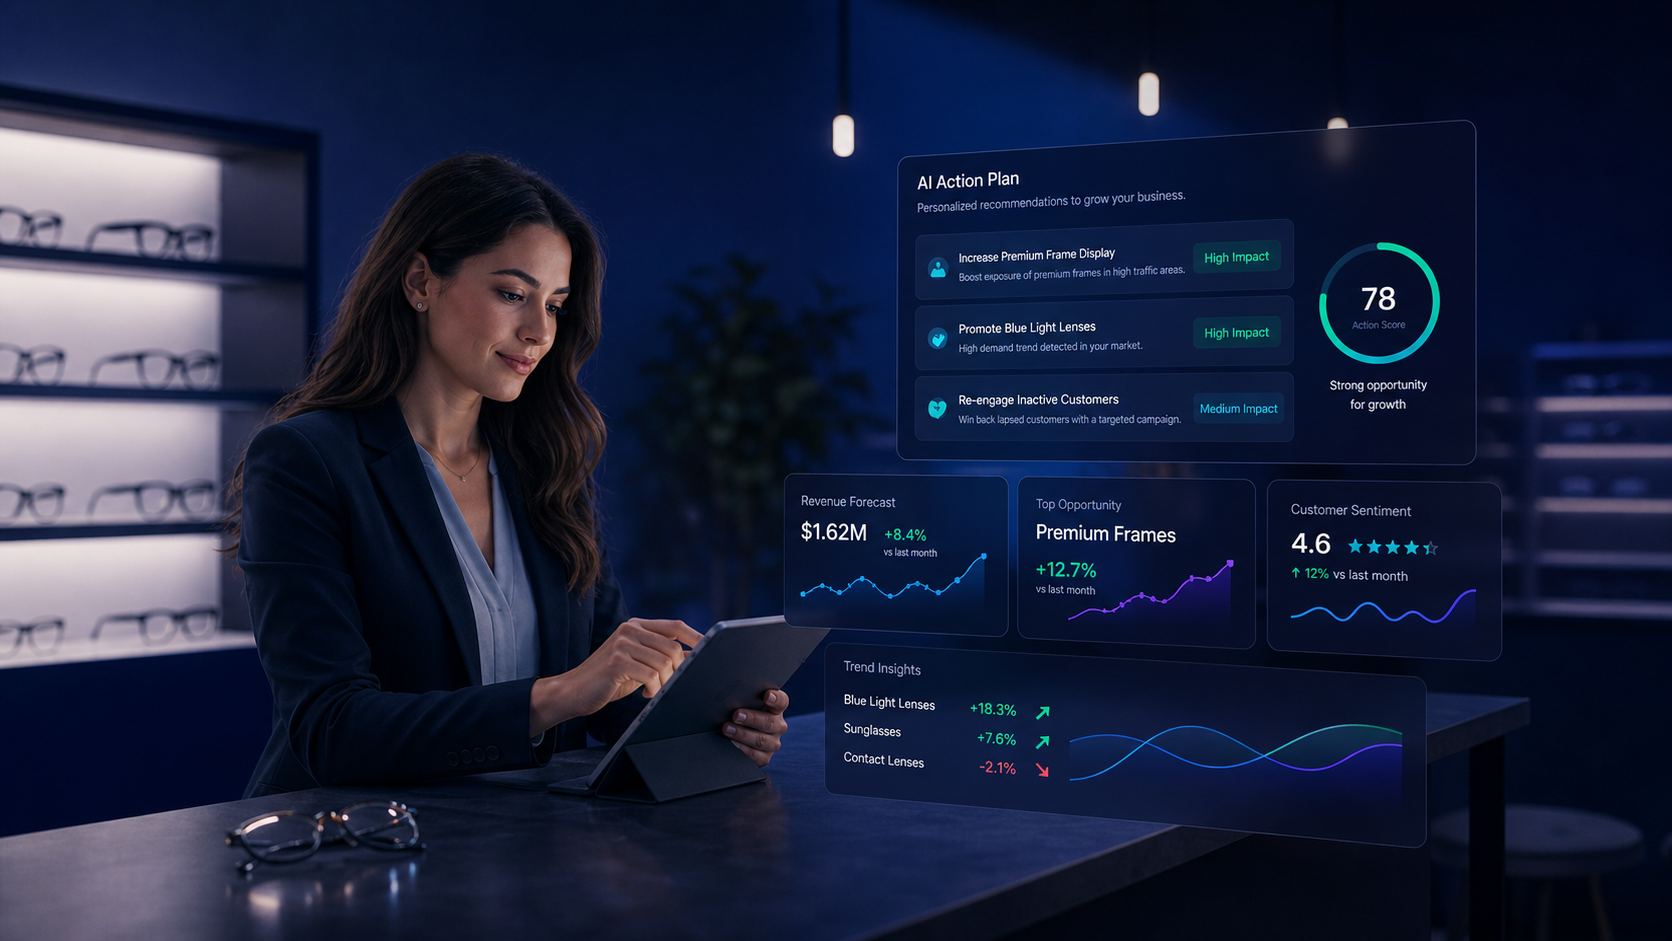
It doesn't just show numbers. It explains what they mean.
OpSightIQ analyzes revenue, orders, average sale, collection rate, traffic, review trends, customer sentiment, and store comparisons to identify what is working, what is slipping, and what should happen next.
The result is not another chart. It is a clear explanation and a practical plan — written in plain English, ready to share with your team.
- Month-over-month and year-over-year performance narratives
- Identification of positive drivers and risk areas by store
- Recommended actions specific to each location's data
- Store manager talking points for team meetings
- Executive summaries for leadership review
Your online reputation is part of your performance.
Google reviews influence where customers choose to go. OpSightIQ monitors your reputation across every location, surfaces risks before they grow, and helps your team respond with confidence.
- Google rating tracking and trend monitoring per store
- Review volume trends and sentiment analysis
- Negative review detection and urgency flagging
- AI-suggested response drafts for review replies
- Cross-store reputation comparison and ranking
- Monthly reputation action plan with growth strategy
From data to direction in four steps
Import or connect your store data
Upload CSV or XLSX exports from your existing systems. No complex integrations required to get started.
OpSightIQ analyzes performance and reputation
The AI engine processes your data and identifies trends, anomalies, and opportunities across every location.
Review AI insights and store comparisons
Clear dashboards and plain-English summaries make it easy to understand what is happening and where to focus.
Take action with clear recommendations
Specific, prioritized action plans give managers and leaders the direction they need to move forward with confidence.
Designed with real optical store operations in mind.
OpSightIQ was built to understand the metrics that matter in optical retail — not generic retail KPIs, but the specific numbers that drive optical store performance.
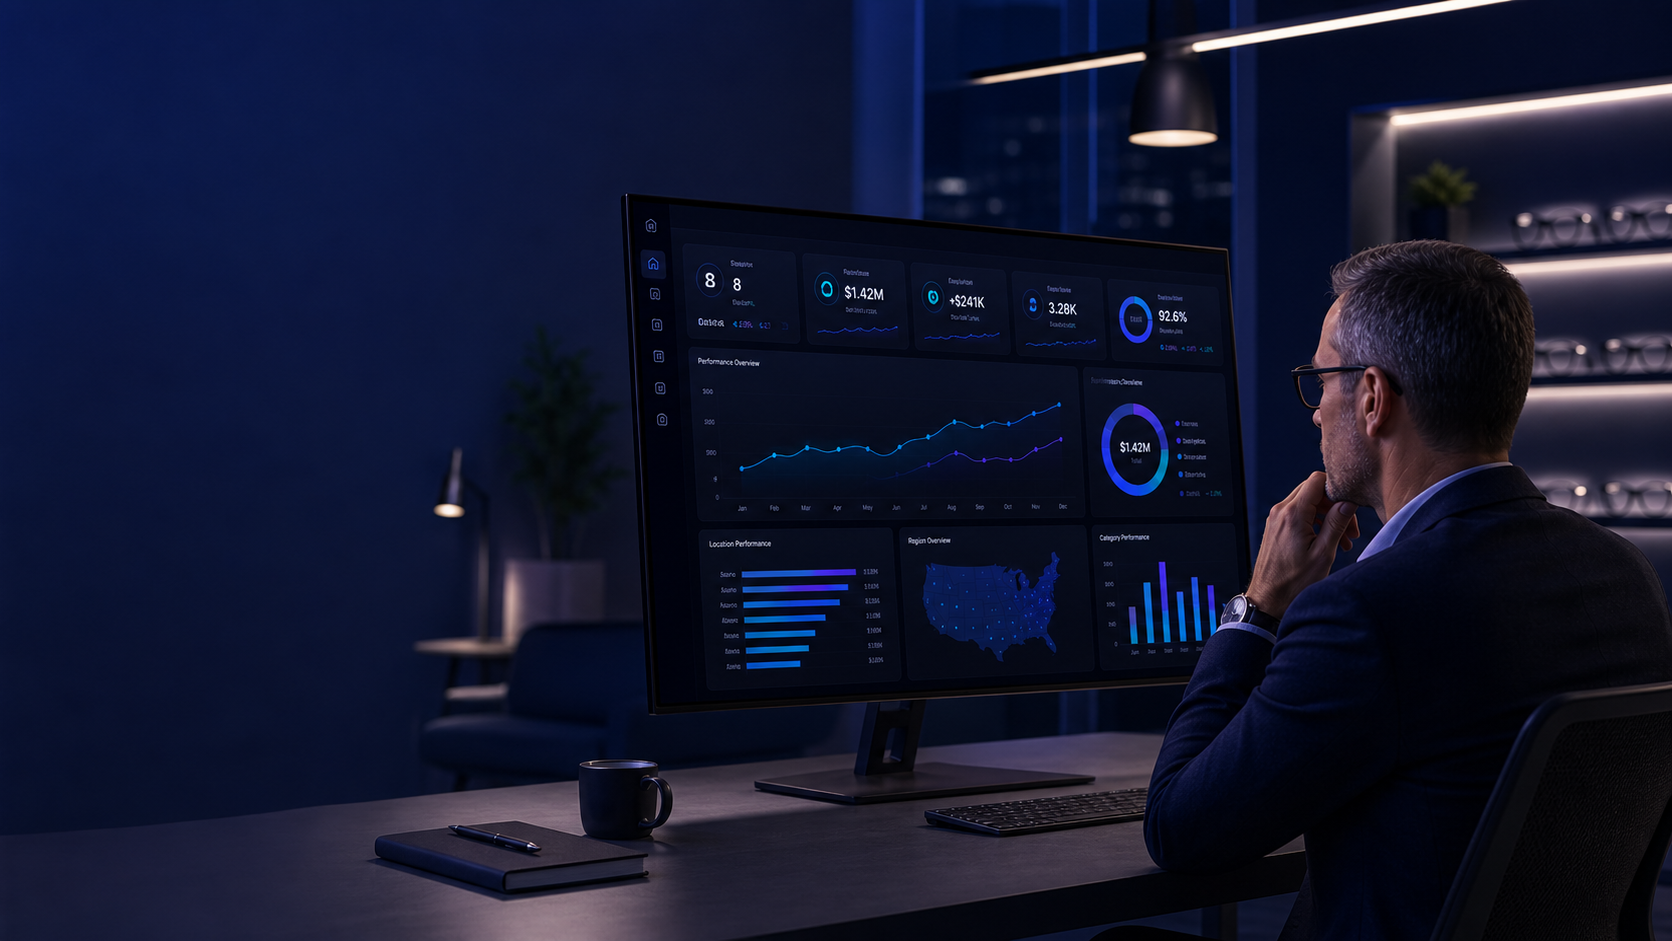
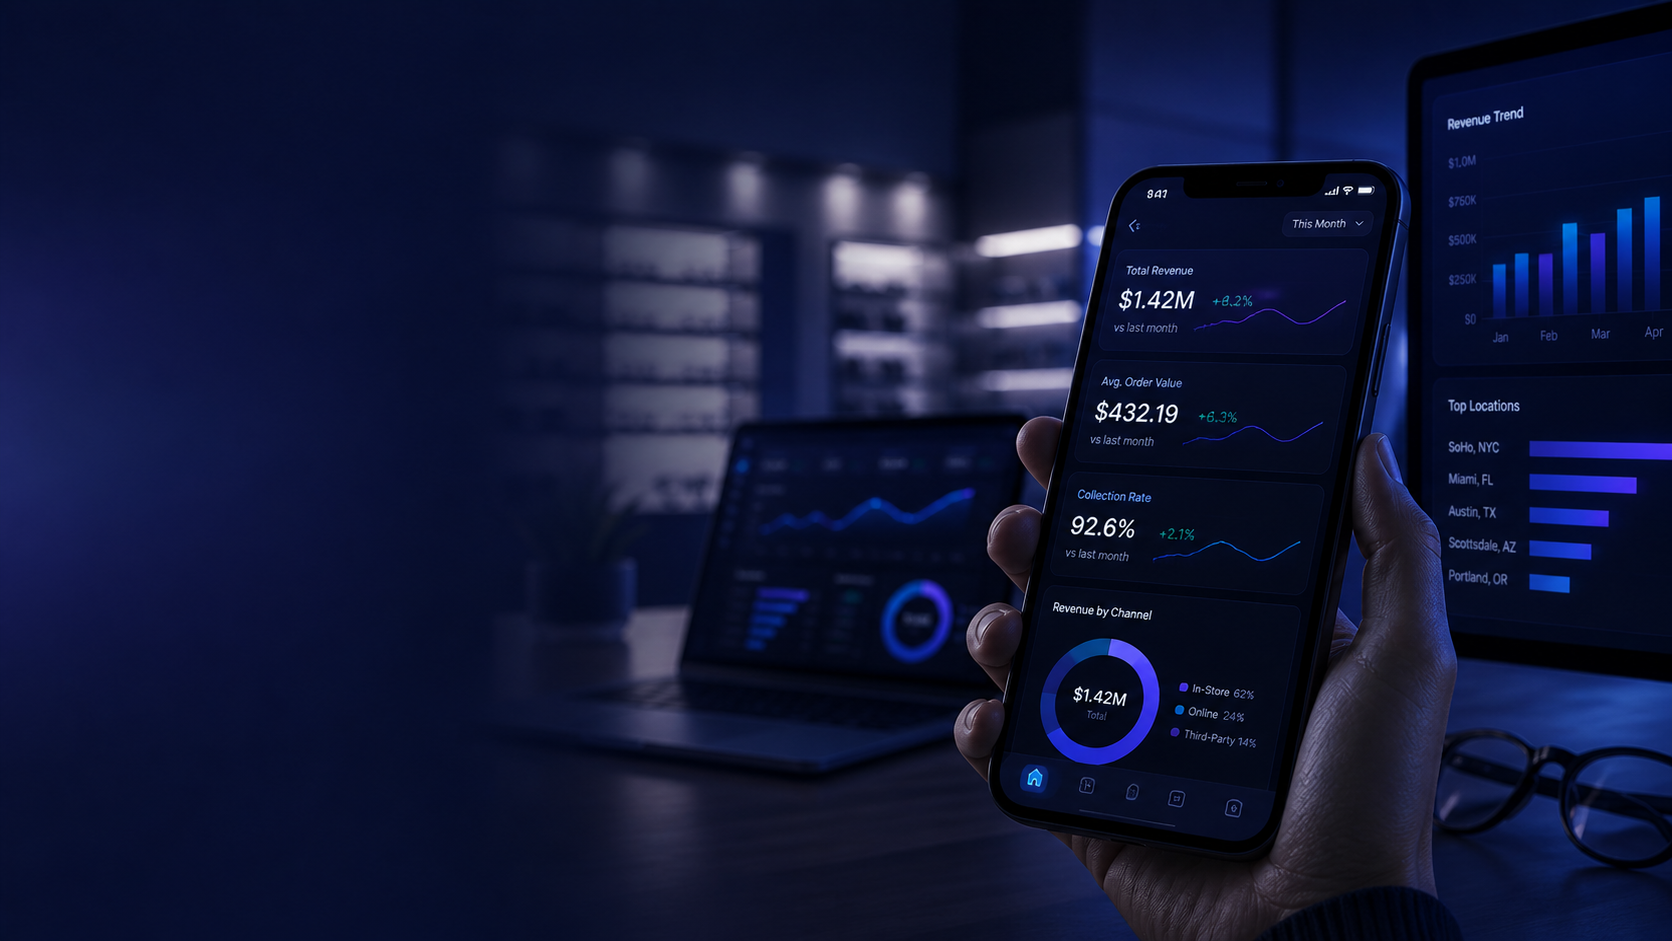
Check your stores from anywhere.
OpSightIQ is fully mobile-responsive. Leaders can check store performance, review AI insights, and monitor reputation from any device — whether they're in the office, at a store, or on the road.
- Full dashboard access on mobile and tablet
- Revenue trends and KPIs at a glance
- Store rankings and comparison data on the go
- Reputation scores and review alerts anywhere
- AI insights available whenever you need them

Designed for easy onboarding and real support.
OpSightIQ is built for operators, not data scientists. Getting started is straightforward, and the platform is designed to grow with your team as your needs evolve.
- Simple data import from your existing reports
- Flexible field mapping for different report formats
- Role-based access so every team member sees what they need
- Admin tools for managing users, stores, and permissions
- Support-friendly design built for real retail operations
Ready to see what your store data is really telling you?
Request a demo and see how OpSightIQ can give your team the clarity and direction they need to perform at their best.